Beyond Party Lines: Understanding Democratic Ticket Splitting
By Lindsay Veazey and Sara Stephenson
Not every voter who supports a Democrat at the top of the ballot makes the same choice farther down the ticket.
For campaigns, that creates an important strategic question: Where is Democratic support most likely to vary between the top and bottom of the ticket?
TargetSmart’s Democratic Ticket-splitter Score provides a new way to examine that question.
What Does the Ticket-splitter Score Measure?
TargetSmart’s analysis measures the variation between Democratic vote share at the top of the ticket and Democratic vote share farther downballot.
Ticket-splitter Formula

Put simply, the formula subtracts downballot Democratic vote share from top-of-ticket Democratic vote share. The bigger that gap, in either direction, the more voters split their tickets between the two races.
For example, if a top-of-ticket Democrat received 55% of the vote in an area and a downballot Democrat received 45%, the result would be +10 percentage points. If the results were reversed, the result would be -10 percentage points. In both cases, the 10-point difference indicates variation in Democratic performance between the two races.
The direction of the difference provides additional context. A positive result means the top-of-ticket Democrat received a greater share of the vote, while a negative result means the downballot Democrat performed better.
The analysis considers numerous combinations of federal and state races, including President, U.S. Senate, U.S. House, Governor, State Senate, and State House contests.
Importantly, this is an aggregate-level measure. It does not reveal how an individual filled out their ballot. Instead, it uses census-block-level election results to identify places where Democratic performance has varied more or less across races.
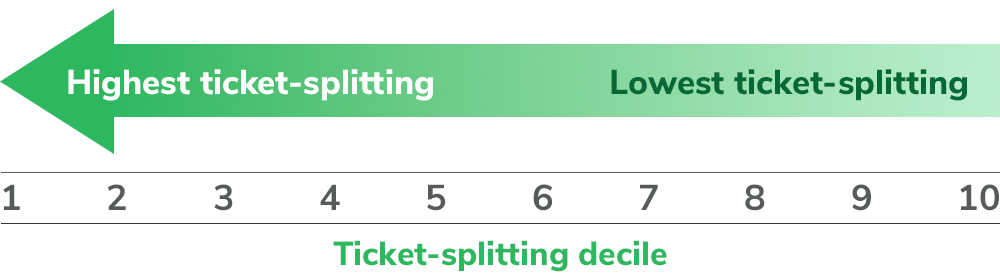
To make the data actionable, TargetSmart assigns voters a ticket-splitting decile score from 1 to 10 based on their census block. Scores of 1–3 indicate higher-than-average ticket splitting within that state, while scores of 7–10 indicate lower-than-average ticket splitting.
Ticket Splitting Looks Very Different Across the Country
TargetSmart’s national analysis shows substantial differences in ticket-splitting behavior.
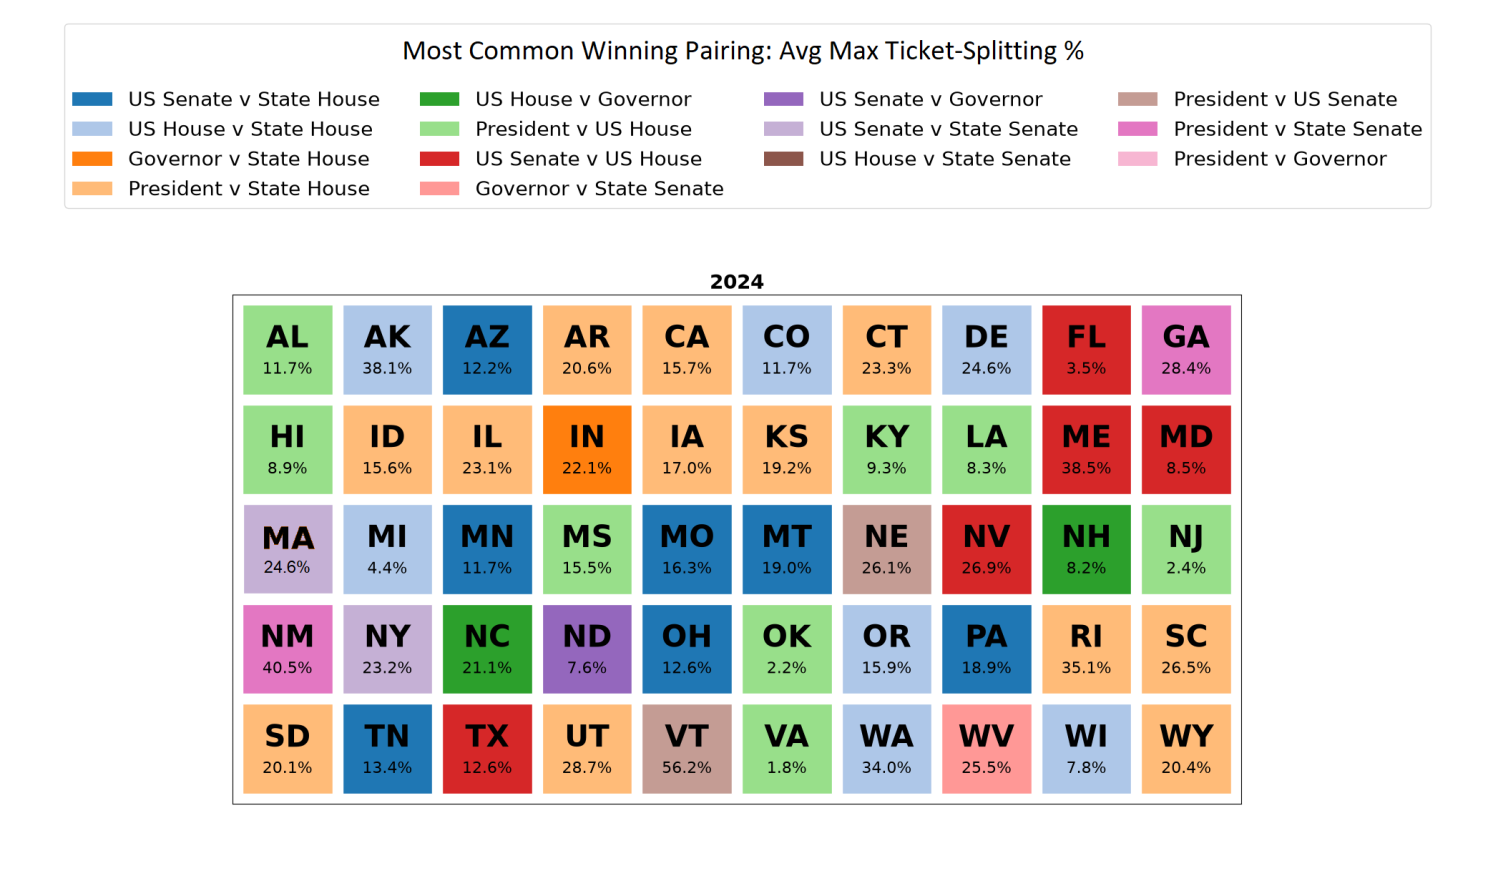
Virginia, Oklahoma, and New Jersey exhibited higher levels of straight-ticket voting in the President/U.S. House comparison, with maximum variation of just 1.8%, 2.2%, and 2.4%, respectively.

At the other end of the spectrum, Vermont recorded the highest ticket-splitting figure in the analysis at 56.2% between President and U.S. Senate. Across 12 states in 2024, President and State House were the most common pairing producing the maximum variation, averaging 22.1%.
As explored in last week’s analysis of roll-off scores, Beyond Turnout: Understanding Where Voters Roll Off the Ballot, the real strategic value becomes clearer when looking within individual states.
Finding Persuadable Opportunities
Ohio provides a useful example of how the Ticket-splitter Score can help identify potential persuasion opportunities.
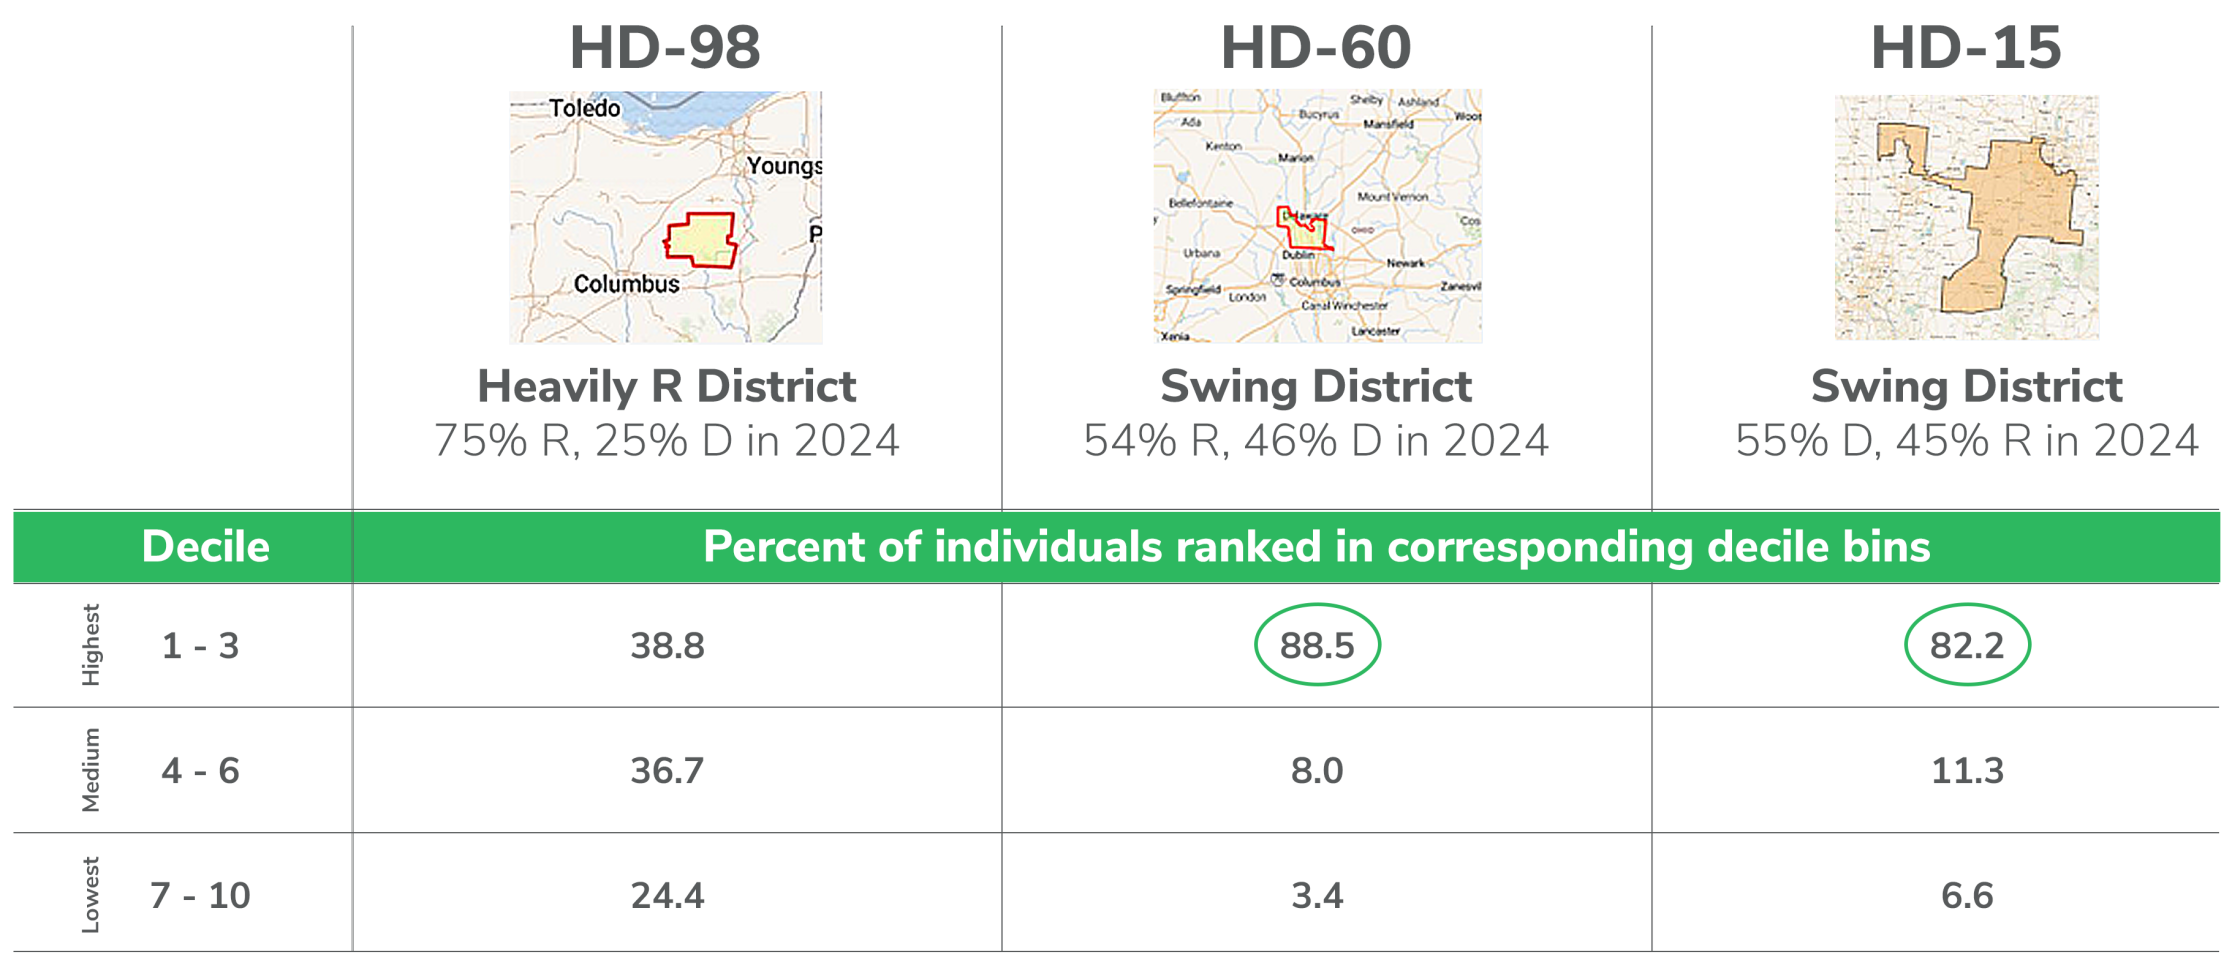
In swing HD-60, 88.5% of individuals were assigned to the three highest ticket-splitting deciles. In another swing district, HD-15, that figure was 82.2%. By comparison, 38.8%of individuals in heavily Republican HD-98 fell into those deciles.
Those differences can help campaigns identify areas where voters have historically shown greater variation in their support for Democratic candidates across the ballot.
TargetSmart’s analysis highlights a potential “sweet spot”: voters in areas that tend to support Democrats at the top of the ticket but show more variation down the ballot.
Campaigns can then layer the Ticket-splitter Score with other attributes. For example, campaigns can combine a persuadable partisanship score, a high likelihood of midterm turnout, and a high ticket-splitting propensity to create a more focused persuasion universe.
Better Data, More Precise Targeting
The Democratic Ticket-splitter Score gives campaigns and state parties another way to identify where Democratic performance is most likely to vary across the ballot.
When combined with other voter intelligence, such as partisanship and turnout scores, ticket-splitting data can help campaigns build more focused persuasion audiences and better prioritize resources.
But there is an important distinction: the Ticket-splitter Score can help determine where to target, not what to say.
That’s where strategy, testing, creative, and an understanding of the electorate still matter.
With competitive races often decided at the margins, understanding where voters are more likely to split their tickets can help campaigns identify persuasion opportunities and focus resources where they may have the greatest impact. Both roll-off and ticket-splitter scores are now available for clients to use at my.targetsmart.com.
Beyond Party Lines: Understanding Democratic Ticket Splitting
By Lindsay Veazey and Sara Stephenson
Not every voter who supports a Democrat at the top of the ballot makes the same choice farther down the ticket.
For campaigns, that creates an important strategic question: Where is Democratic support most likely to vary between the top and bottom of the ticket?
TargetSmart’s Democratic Ticket-splitter Score provides a new way to examine that question.
What Does the Ticket-splitter Score Measure?
TargetSmart’s analysis measures the variation between Democratic vote share at the top of the ticket and Democratic vote share farther downballot.
Ticket-splitter Formula
Put simply, the formula subtracts downballot Democratic vote share from top-of-ticket Democratic vote share. The bigger that gap, in either direction, the more voters split their tickets between the two races.
For example, if a top-of-ticket Democrat received 55% of the vote in an area and a downballot Democrat received 45%, the result would be +10 percentage points. If the results were reversed, the result would be -10 percentage points. In both cases, the 10-point difference indicates variation in Democratic performance between the two races.
The direction of the difference provides additional context. A positive result means the top-of-ticket Democrat received a greater share of the vote, while a negative result means the downballot Democrat performed better.
The analysis considers numerous combinations of federal and state races, including President, U.S. Senate, U.S. House, Governor, State Senate, and State House contests.
Importantly, this is an aggregate-level measure. It does not reveal how an individual filled out their ballot. Instead, it uses census-block-level election results to identify places where Democratic performance has varied more or less across races.
To make the data actionable, TargetSmart assigns voters a ticket-splitting decile score from 1 to 10 based on their census block. Scores of 1–3 indicate higher-than-average ticket splitting within that state, while scores of 7–10 indicate lower-than-average ticket splitting.
Ticket Splitting Looks Very Different Across the Country
TargetSmart’s national analysis shows substantial differences in ticket-splitting behavior.
Virginia, Oklahoma, and New Jersey exhibited higher levels of straight-ticket voting in the President/U.S. House comparison, with maximum variation of just 1.8%, 2.2%, and 2.4%, respectively.
At the other end of the spectrum, Vermont recorded the highest ticket-splitting figure in the analysis at 56.2% between President and U.S. Senate. Across 12 states in 2024, President and State House were the most common pairing producing the maximum variation, averaging 22.1%.
As explored in last week’s analysis of roll-off scores, Beyond Turnout: Understanding Where Voters Roll Off the Ballot, the real strategic value becomes clearer when looking within individual states.
Finding Persuadable Opportunities
Ohio provides a useful example of how the Ticket-splitter Score can help identify potential persuasion opportunities.
In swing HD-60, 88.5% of individuals were assigned to the three highest ticket-splitting deciles. In another swing district, HD-15, that figure was 82.2%. By comparison, 38.8%of individuals in heavily Republican HD-98 fell into those deciles.
Those differences can help campaigns identify areas where voters have historically shown greater variation in their support for Democratic candidates across the ballot.
TargetSmart’s analysis highlights a potential “sweet spot”: voters in areas that tend to support Democrats at the top of the ticket but show more variation down the ballot.
Campaigns can then layer the Ticket-splitter Score with other attributes. For example, campaigns can combine a persuadable partisanship score, a high likelihood of midterm turnout, and a high ticket-splitting propensity to create a more focused persuasion universe.
Better Data, More Precise Targeting
The Democratic Ticket-splitter Score gives campaigns and state parties another way to identify where Democratic performance is most likely to vary across the ballot.
When combined with other voter intelligence, such as partisanship and turnout scores, ticket-splitting data can help campaigns build more focused persuasion audiences and better prioritize resources.
But there is an important distinction: the Ticket-splitter Score can help determine where to target, not what to say.
That’s where strategy, testing, creative, and an understanding of the electorate still matter.
With competitive races often decided at the margins, understanding where voters are more likely to split their tickets can help campaigns identify persuasion opportunities and focus resources where they may have the greatest impact. Both roll-off and ticket-splitter scores are now available for clients to use at my.targetsmart.com.