This blog post marks the first in a series of reports digging deeper into the data from the 2020 general election. You can find an introduction to the series and background on TargetSmart’s voter file here.
In 2020, more young voters cast a ballot than ever before. In total, voters aged 18-39 accounted for more than 44 million voters in 2020, compared to under 39 million voters in that age group in 2016. Who were these voters and what does that tell us about the emerging electorate?
A Look at States
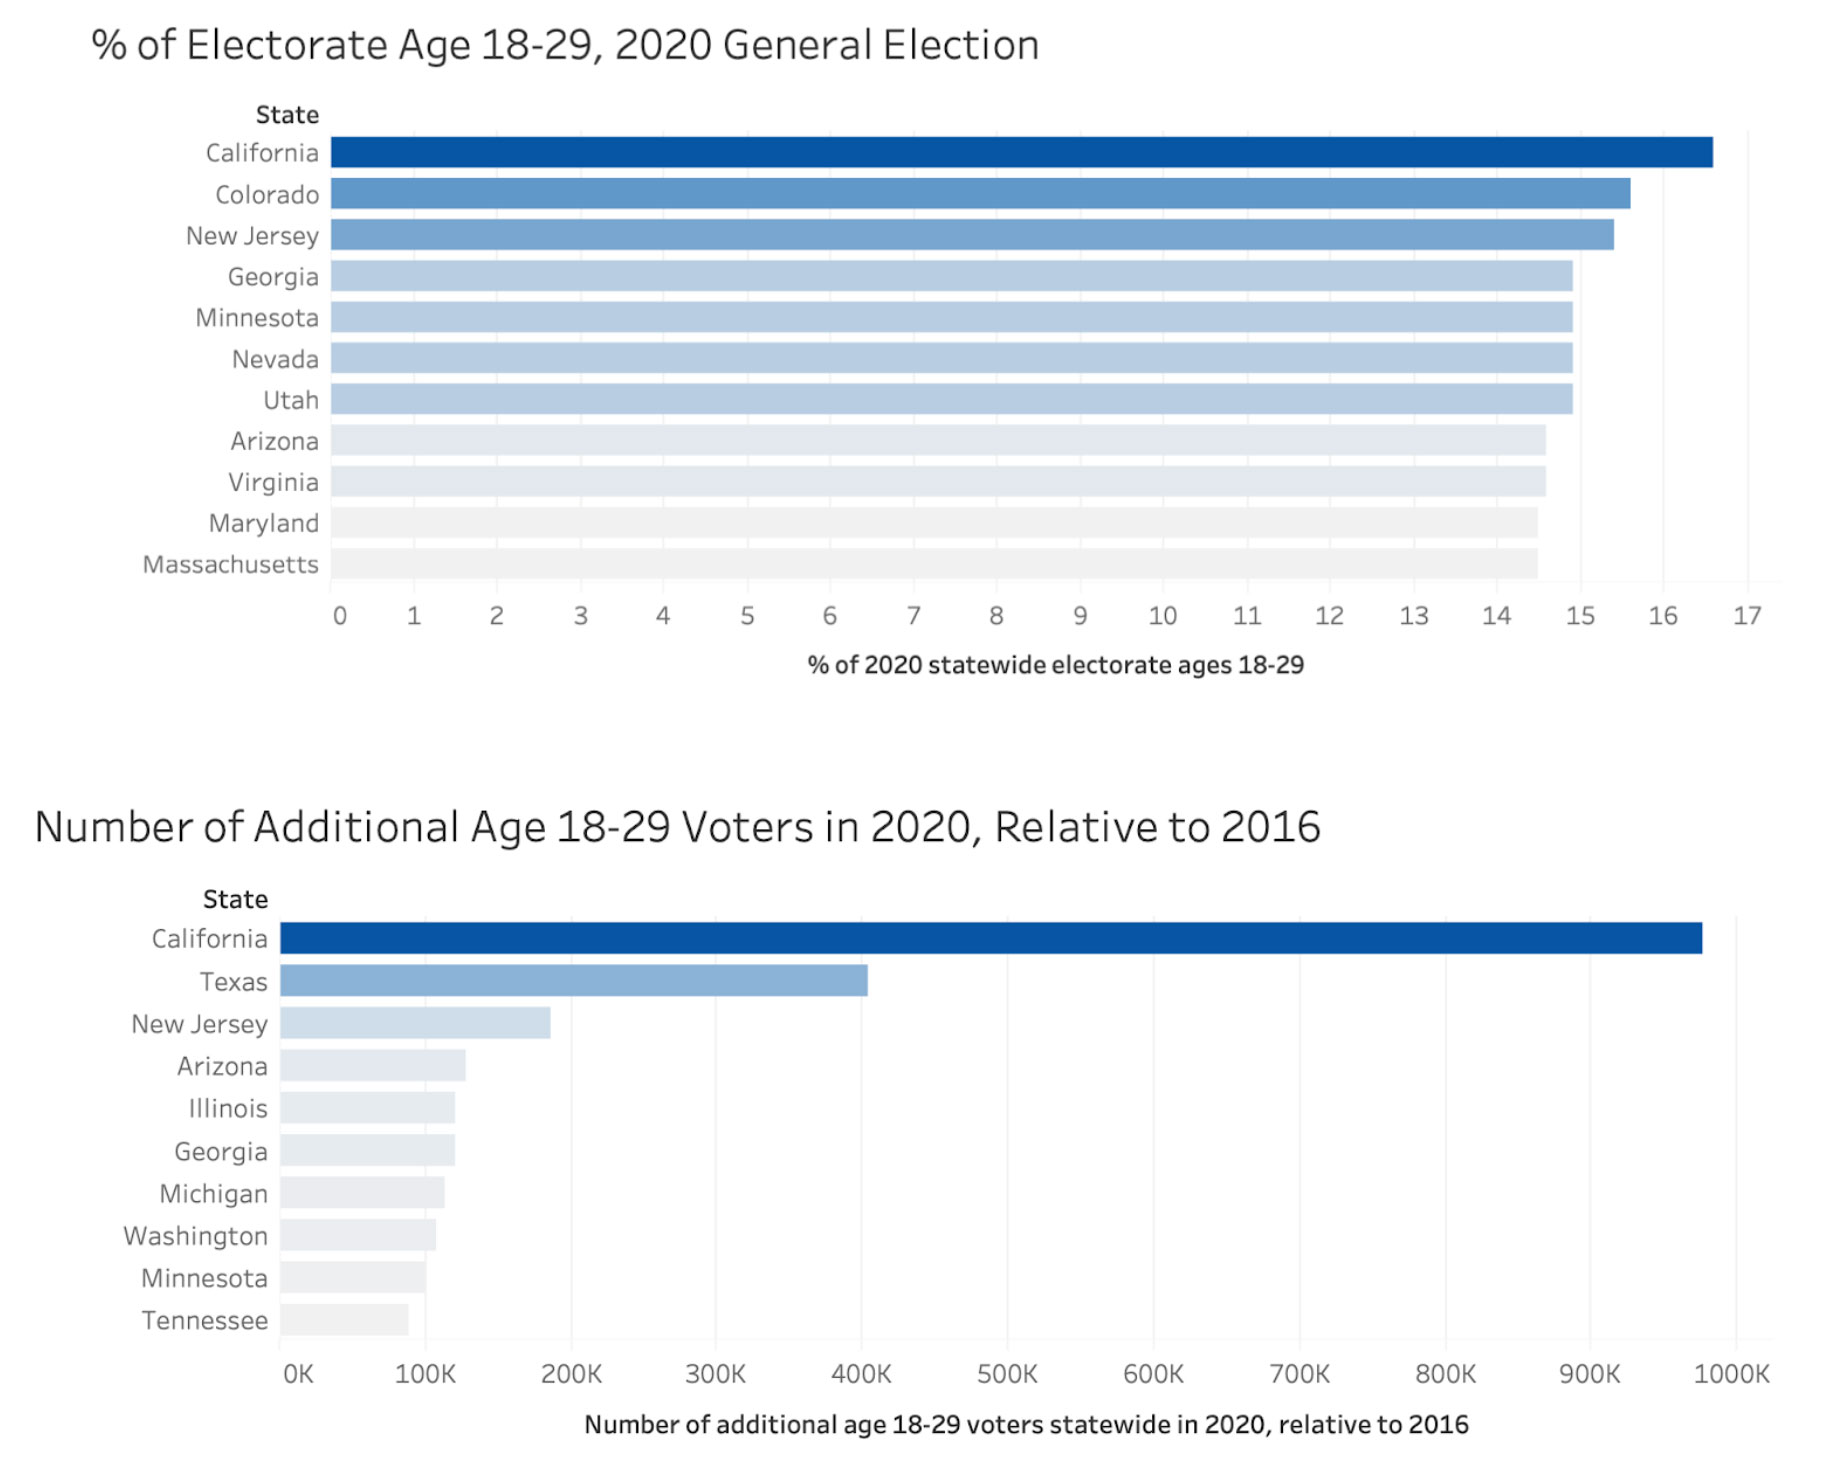
The youth vote made up nearly 17% of the electorate in California, the highest in the country, and just over 15% in Colorado and New Jersey. Relative to 2016, almost one million more young people voted in California in the 2020 election, a growth of over two percent.
Diversity
While it has been well reported that the 2020 electorate was the most diverse in American history, until now the only tool we had to validate that point was through exit polls and traditional polling, both of which are imperfect. Now that we have processed data from virtually every jurisdiction in the country, we can dig deeper and analyze the composition of the electorate with certainty.
Young voters were more diverse than the population as a whole:
Hispanic voters represented 7.8% of the electorate nationwide, but when you look at the vote share among 18 – 29 year olds, Hispanics accounted for 13.1% of the electorate. We see a similar trend with African American voters who represented 8.3% of the electorate while they accounted for 8.8% of voters in that age group. The surge is even more striking for AAPI voters who represented 2.6% of all voters and 3.2% of voters ages 18-29, a massive increase for a relatively small population.
Vote Share & What it Means
In 2020, voters in the 18-29 and 30-39 age groups expanded modestly as a share of the electorate (+.5% & +.2%, respectively). Meanwhile, voters age 40-49 and 50-64 dropped by a significant margin (-1.2% & -2.5% respectively).
Interestingly, voters age 65 – 74 did increase vote share (+1.2%) and voters 75+ accounted for the largest surge (+1.6%). While these surges are numerically significant, it is likely the result of baby boomers aging into these higher brackets and people living longer than ever before.
Party ID
Among states that report party registration, Democrats have a profound edge among voters age 18-39. 52% of voters age 18-29 are registered Democrats, compared to 34.8% Republican. 53% of voters age 30-39 are registered as Democrats compared to 34.1% Republican.
Increasingly Reliable Voters
The best indicator of whether someone will vote in future elections is if they voted in past elections. In 2016, we saw a surge in young voters and they have continued to turn out.
Take a look at voters 30-39 years old. In 2016 there were just over 4 million first time voters in this cohort. This year, there were fewer than 3 million. That’s not because voters in this age group didn’t turn out, it’s because voters in this age group are increasingly reliable voters: 48.5% are now considered ‘Frequent voters,’ an 11% jump from the 2016 election.
Looking ahead to future elections this voting bloc of young, diverse voters will likely continue to turn out and have a profound impact on the electorate as a whole.
We look forward to continuing this conversation with you. If you have any questions, comments or feedback, feel free to email me at tom@targetSmart.com or tweet me at @tbonier.

