
In recent election cycles, there has been significant discussion surrounding the diminishing segment of the American electorate considered persuadable – voters whose decisions a well-executed presidential campaign could potentially sway. Is this group of voters steadily shrinking? Do the majority of voters solidify their preferences well in advance of casting their ballots? Now that President Biden is the presumptive Democratic nominee, the team at TargetSmart is looking at the landscape heading into the general election and set out to answer these questions. The answer is more complex than you might have thought.
How many states are actually winnable, in a Presidential election, for both parties?
- Assessing the last three presidential election cycles reveals 11 instances of partisan state shifts resulting in a change of the winning party.
- The most substantial shift from Democratic (D) to Republican (R) that led to a winning party change occurred in Iowa between 2012 to 2016, with a 15.4% margin shift.
- The most substantial R to D shift that led to a winning party change was seen in Georgia from 2016 to 2020, with a 5.4% shift.
- Within this set of 11 state party shifts, the average cycle-to-cycle shift is 6.3%, with a standard deviation of 4.6%. Shifts leading to party changes within one standard deviation of the mean range from 2% to 11%. So, states with swings under the 11% mark are categorized as “swing” states.
- In 2020, 17 states fell within the 11% margin, suggesting they could reasonably be winnable by both major parties if current patterns persist. Margins ranged from a D advantage of 10.8% in New Mexico to an R advantage of 10.0% in Ohio. This aligns with the figures from 2016 when 17 states were within this margin, and in 2012 when 18 states fell into this category.
- Among these 17 states, five underwent a party change between 2016 and 2020, all transitioning from R to D. Michigan, Pennsylvania, and Wisconsin experienced marginal shifts, while Georgia (5.4%) and Arizona (3.9%) saw the most significant changes.
Margin of victory shifts over the last 3 cycles for ‘winnable’ States (Value on y-axis represents a D win)
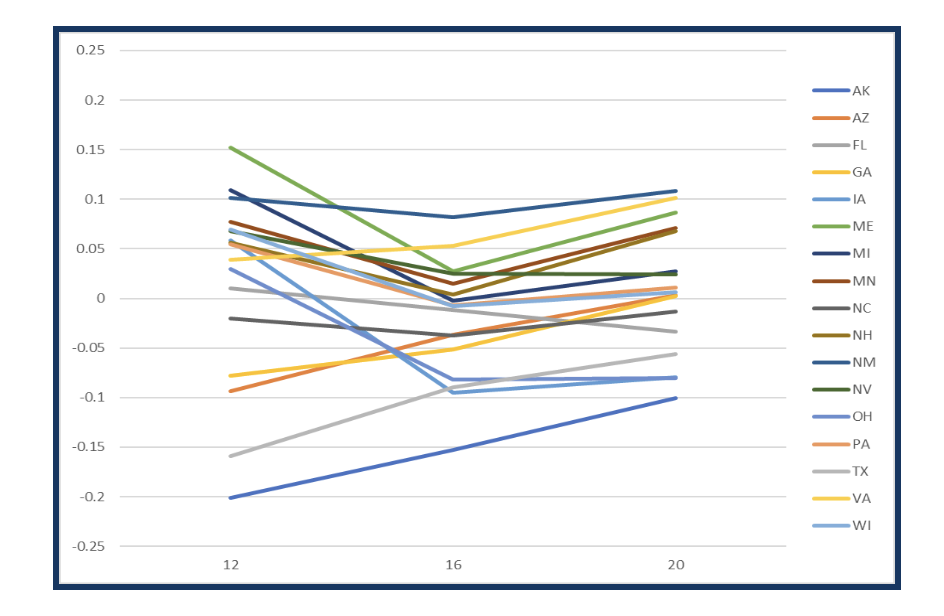
The chart above illustrates the narrow margins of victory that have fluctuated across the last three election cycles. It’s evident that there exists a considerable spectrum of potential party swings at the presidential level. Contrary to conventional wisdom, the data suggests a larger number of states are in play than one might initially assume.
But what about swing voters? There’s certainly fewer of them in today’s political climate, right?
- The perception that there are fewer swing voters in today’s political climate may not hold true. Any count of swing voters depends on the method of calculation.
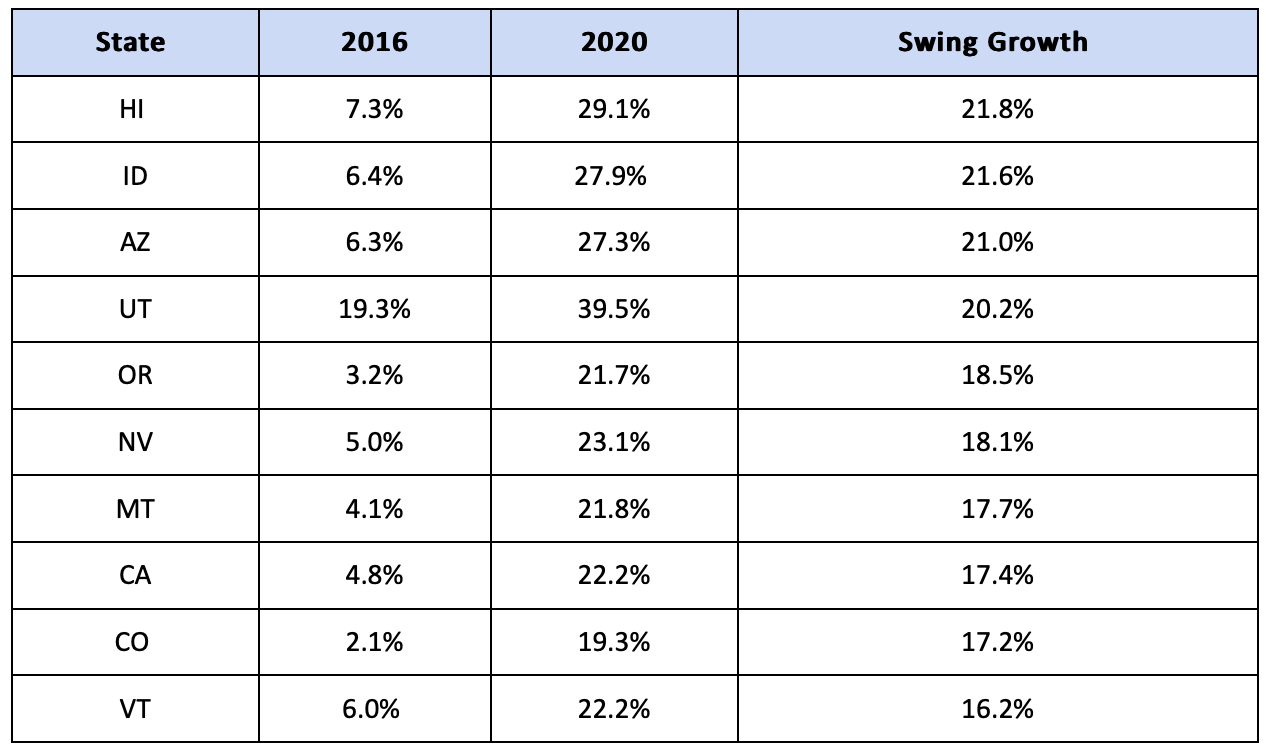
- TargetSmart’s analysis found that in 49 of the 51 states (including DC), the combined change in total voters on the D and R ballot lines increased from 2016 to 2020. Alaska and Alabama were the only exceptions.
- This trend is primarily due to a widespread increase in voter turnout during the 2020 elections. The rise in these numbers was driven by a surge of new voters entering the electorate. Consequently, these figures propose a measure of potential swing volatility that cannot be solely explained by past voter behavior in previous cycles.
- The fact that the surge in new voters aligns with existing partisan patterns is somewhat inconsequential, as this doesn’t necessarily predict the partisan breakdown of any future influxes of new voters.
Change in Swing Voters 2016 v. 2020
Note: It’s important that we caveat this data with the acknowledgement of changes in ballot access laws in many states since the onset of the pandemic.
Now, what if we look at the change in margins of victory across cycles? Would this tell us something different than counting vote total changes?
- In short, yes. Only twelve states saw growing shares of swing voters from 2016 to 2020, when isolating the impact of new votes cast and focusing solely on the variance in Democratic margins of victory. New Mexico, New Hampshire, and Georgia are the only likely swing states in this group.
- This observation, coupled with our first approach, highlights the influence of two dominant trends:
- Between 2012 to 2016, there was a notable ideological realignment among the electorate, establishing a high baseline level of fluctuation in Democratic versus Republican margins that was not replicated in the shift from 2016 to 2020.
- Simultaneously, the national turnout share among voting-age individuals in 2020 reached the highest point the US has seen in 60 years. While there were 7.4 million additional votes cast in 2016 compared to 2012, the 2020 election witnessed an increase of 17 million additional votes relative to 2016.
So, what does this all mean?
- First, it’s important to note that not all swing states exhibit the same characteristics from one election cycle to another. In the period from 2016 to 2020, Georgia and Arizona demonstrated increased volatility across all metrics, while the heightened 2020 turnout in Michigan, Pennsylvania, and Wisconsin resulted in patterns very similar to those observed in 2016.
- Contrary to certain narratives, elections remain fiercely competitive in states across the country, and the number of ‘winnable’ states for each party has remained relatively stable over the last three presidential cycles.
- The dynamics of elections, campaigns, and candidates exert a significant influence, particularly evident in the last two presidential cycles where Trump’s candidacy played a pivotal role in a fundamental ideological realignment of the electorate.


Leave A Comment