An Assessment of the AAPI Vote in the 2020 Presidential Election.
As the last remaining votes of the 2020 general election are counted and the legal challenges continue, we’ve begun the work of digging through the available data to better understand what happened. This work will continue for the next several weeks, as states report the individual level history of who participated in this election. In the meantime, we have a robust dataset from which we can begin to draw conclusions, in the over 100 million Americans who cast a ballot before Election Day.
From this dataset emerges perhaps one of the least heralded stories that might just stand as one of the most important electoral trends behind the results: an unprecedented surge in participation among Asian American/Pacific Islander (AAPI) voters.
First, some background — the characterization of individuals as AAPI is incredibly broad, covering Americans with roots in any one of more than 30 nations. That said, in this analysis we use the broad grouping, both because that is how the historical population data is grouped, and because from a programmatic perspective, much of the AAPI organizing takes place under that broad coalition umbrella.
One of the fastest growing racial/ethnic groups in this country (25% growth between 2010 and 2017), AAPI communities have also historically been among the lowest turnout groups. That changed dramatically in this election cycle.
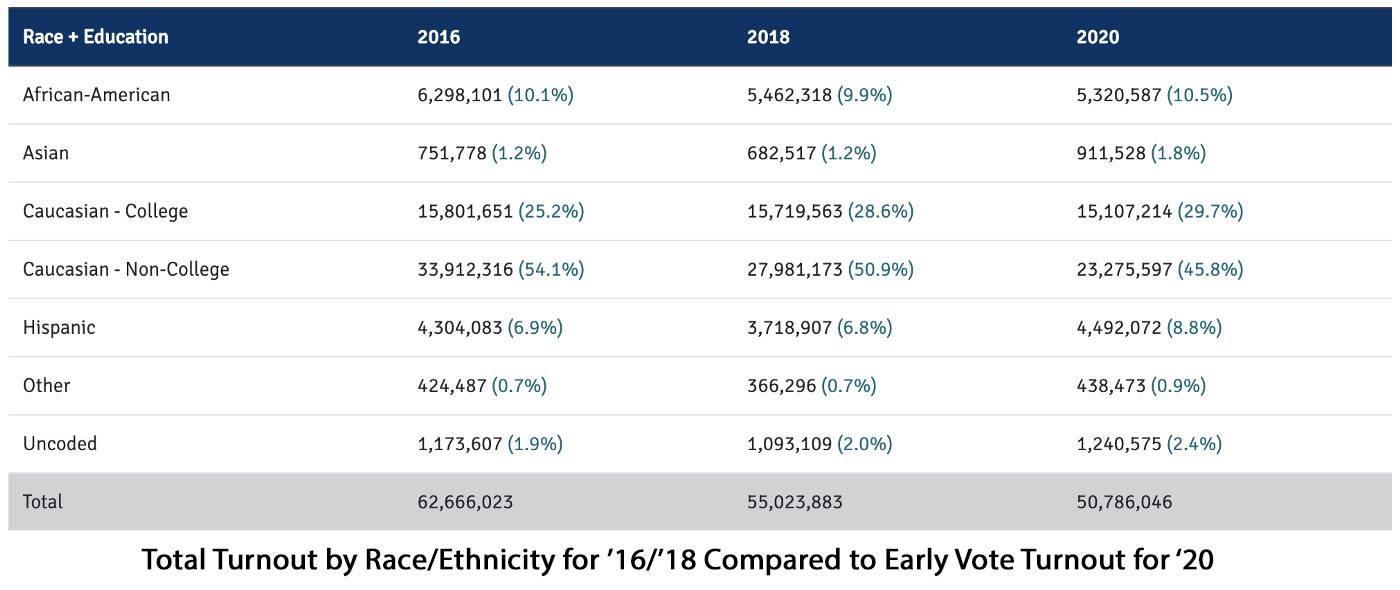
Focusing on presidential battleground states, 751,778 AAPI voters cast a ballot, in total, in the 2016 presidential election. This year, in the early vote alone, 911,393 AAPI voters turned out — 21% more voters than the entire 2016 AAPI turnout in these key states. The only other group to surpass their total 2016 turnout via the early vote alone in 2020 were Latino voters, by 4%.

Assessing AAPI turnout at the state level in battleground states, in all but 3 states (PA, VA, WI), AAPI early vote turnout exceeded their total 2016 turnout. In every single battleground state, the AAPI turnout surged (relative to 2016) by more than any other group.
Among the states flipping from red to blue in this cycle, Georgia and Arizona stand out, with the former not having supported a Democrat for president since 1992 and the latter since ’96. In both states, the narrow decisive vote margin was less than the surge in AAPI voters. In Georgia, AAPI early voters exceeded their total 2016 turnout by an astounding 58%. Arizona saw a 41% surge, again, just among the early vote.
The exit polls, while an imperfect tool to measure voter turnout and candidate support levels, are helpful in providing a broad sense of how AAPI voters. They suggest that, in 2020, Vice-President Biden carried AAPI voters by a margin of almost 2 to 1, bolstering the case that the AAPI vote surge was a key component to Vice President Biden’s win, especially in narrowly decided states with significant AAPI population, including Arizona, Nevada, Georgia, and Michigan.
The organizers who helped inspire this historic surge in turnout will undoubtedly have an important story to tell, as far as how they succeeded in driving the single largest turnout surge in 2020. A complex messaging environment, including a President using racist terms regarding the coronavirus, Asian Americans being subjected to racist attacks in their communities, AAPI voters allying themselves with the Black Lives Matter movement, and a Vice-Presidential nominee with AAPI heritage likely all contributed to these organizing efforts.
As we look forward to two critically important Senate run-off elections in Georgia in January and the subsequent midterm elections in 2022, a key question will be to what extent this coalition can be reassembled, especially among AAPI voters who cast a ballot for the first time in the 2020 election.
We’ll update this analysis as we compile the full vote history, but to be clear, the addition of that information will only show an increased surge in AAPI vote as the Election Day votes are added to the early vote totals.


