The pandemic will have had a profound impact on this year’s election.
TargetSmart is committed to studying how the pandemic has impacted voters’ views on voting and we are keeping a close eye on how it is affecting the electorate more broadly.
Earlier this year, we saw a significant voter registration surge compared to the same time in the 2016 cycle. As the pandemic spread in March, April and May, registration numbers plummeted.
- Since the beginning of the stay at home orders this year, the total number of registrations went down from 1,663,261 in March to 194,596 in May. By comparison, in May 2016, 1,490,631 new voters registered.
- In March 53,653 people were registering per day, exceeding the number of voters registering per day in the same month in 2016, when 47,427 voters registered.
- This trend turned downward in the months of April and May. We saw an average of 20,788 and 11,176 new registrations per day, respectively, whereas this same period in 2016 saw an average of 46,267 and 48,084 newly registered voters per day.
Beyond the Numbers: Who is Registering to Vote?
Digging a little deeper, we are able to aggregate state voter files to look at equal length registration periods before and after March 13th, 2020 (the date we’ve identified as when COVID-19 shutdowns began to be implemented) to get a better understanding of who is registering to vote.
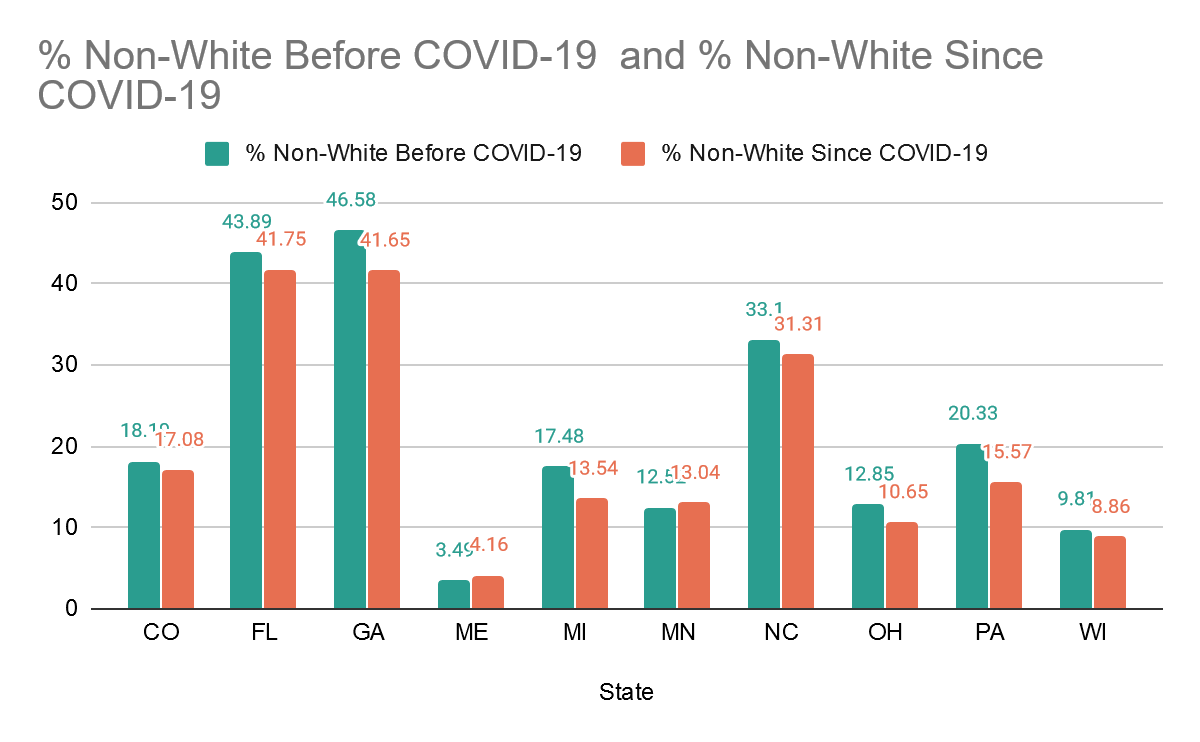
Here’s what we’ve found looking at 10 potential battleground states (CO, FL, GA, ME, MI, MN, NC, OH, PA, and WI):
- In all of those states except for ME and MN, the people who’ve registered since 3/13 have been whiter than the same period before. The most significant shifts are in GA, PA, and MI. (Note: Where self-reported race is not available, a TargetSmart model is used.)
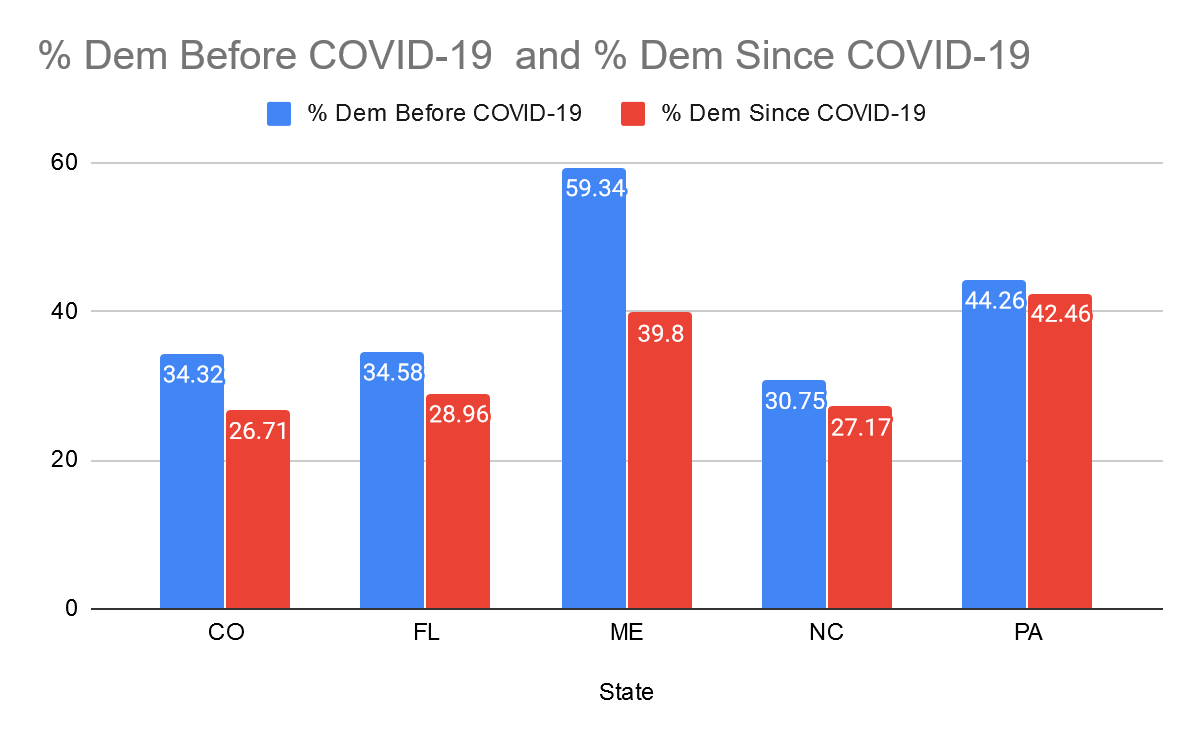
- Only five state voter files include data about party registration, but in all five of those states, a smaller percent of the new registrants are Democrats after 3/13 than before. With ME and CO leading the way.
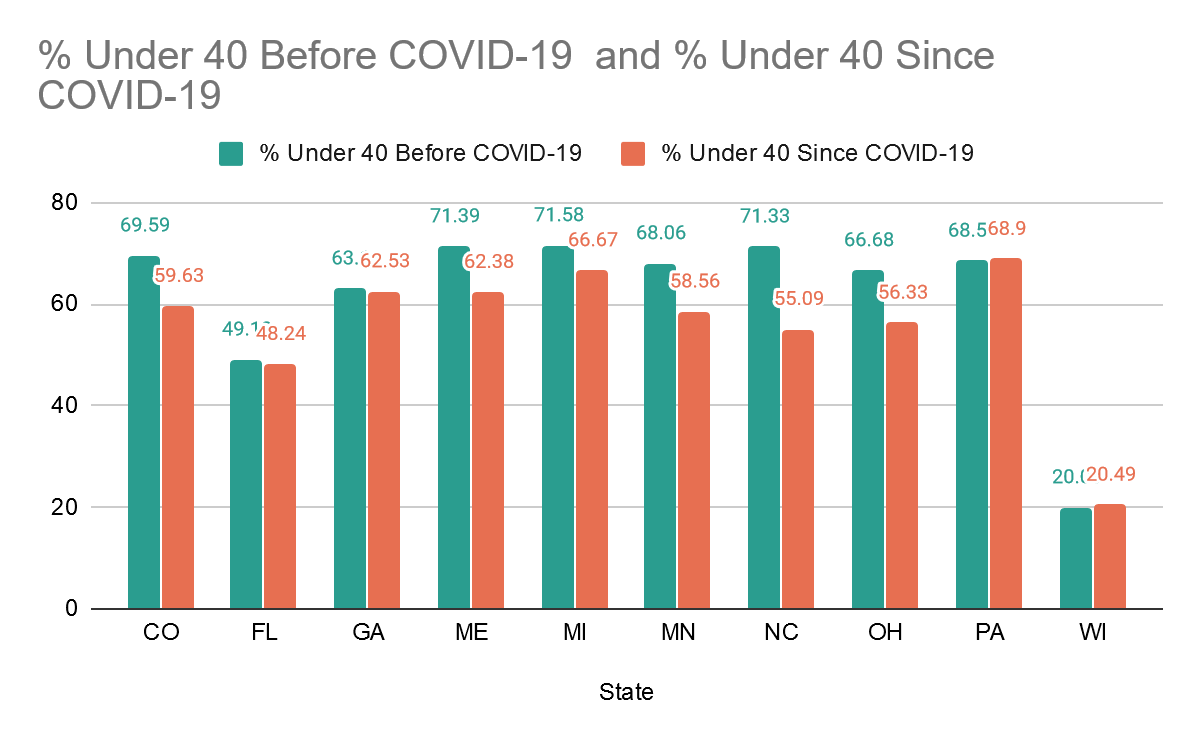
- In 8 of the 10 states, the new registrants since 3/13 are older than in the same period before 3/13. The exceptions are very slight in PA and WI, while the changes in places like CO, ME, MN, NC, and OH are quite dramatic.
While the overall drop in registration, as well as a lower share attributed to traditionally Democratic groups may be concerning, the good news is that there’s plenty of time to close the registration gap.
We have identified how many people would have to register to close the gap in each of the above demographics. Below is a look at how many people would have to register to close the gap in each of the above demographics.
| State | # Non-White Registrants | # Registrants Under 40 | # Democratic Registrants |
|---|---|---|---|
| CO | 240 | 2,156 | 1,647 |
| FL | 862 | 353 | 2,266 |
| GA | 2,298 | 267 | Party Reg Data Unavailable |
| ME | No Deficit | 141 | 306 |
| MI | 1,325 | 1,651 | Party Reg Data Unavailable |
| MN | No Deficit | 5,471 | Party Reg Data Unavailable |
| NC | 1,115 | 10,152 | 2,235 |
| OH | 539 | 2,533 | Party Reg Data Unavailable |
| PA | 4,041 | No Deficit | 1,531 |
| WI | 1,383 | No Deficit | Party Reg Data Unavailable |
While COVID had a substantial impact on voter registration among likely Democratic voters, the registration gap is not only surmountable, with smart, data-driven organizing progressives can make up for lost time, expand the electorate and engage more Americans in the voting franchise.

