
Commercial voter files hold great promise for studying certain aspects of American politics. These files, compiled by private vendors from administrative data collected by state and local governments, aim to get records for every registered voter in the country and are often supplemented with additional data from other sources. You can read more about them in our February 2018 study.
Pew Research Center’s reports on American politics have long relied on public opinion data collected from interviews with random samples of the public. After all, the best way to understand people’s attitudes and beliefs is to ask them directly. However, administrative data like those contained in voter files can be useful, particularly as a way of capturing political behavior. Survey measurements can also be married with administrative data for an even more complete picture. (For example, we matched survey respondents to their voter records to explore how 2016 voters feel about the president and for a portrait of 2016 voters. The voter file can also be used as a sampling frame.)
In this post, we’ll describe how voter files can be analyzed directly to examine patterns in voter registration in the 30 states plus the District of Columbia where people are allowed to register with a political party.
Background
Pew Research Center purchased two voter file “snapshots” — random 1% samples of a full voter file. The first was purchased in June 2015 and the second in July 2018. While the full voter file contains about 200 million records, these files contain about 2 million records each. The Center purchased its voter files from TargetSmart, one of several commercial voter file vendors in the U.S.
One advantage of studying voter files is that they contain detailed records of whether people have voted in particular elections. This is information that’s not always possible to get reliably from individuals themselves. (In a 2018 study of voting in the 2016 election, we couldn’t locate turnout records for about one-in-ten survey respondents who told us they had voted in the presidential election. It’s likely that some people reported voting when they actually didn’t.)
Voter files also contain some demographic information. Given their size, voter files allow researchers to study small subgroups of voters. For example, the 1% voter file samples used in this analysis include more than 330,000 records of individuals under 30. That makes it possible to analyze age at a granular level (in this post, we look at individual birth years). While surveys allow us to go into great depth substantively, it would be prohibitively expensive to expand the sample of a standard survey so it’s large enough to get to this level of granularity.
While there are advantages to using voter files, there are also important limitations. First, the underlying data are collected from state voter registration databases, and these databases are not intended to be archival histories of individual voting patterns. The only information available in the original record in all states is a voter’s name, address, age (or date of birth), political jurisdiction and records of past voting. Some state files also include measures of race and/or gender.
Voter file vendors attempt to fill in these gaps. Most of the companies that compile state voting records use predictive modeling to try to predict a voter’s race, education, religion, vote propensity and partisanship, among other things.
These modeled variables have differing levels of reliability. For example, our previous work compared the voter file-modeled variables to self-reported information and found that most vendors do fairly well in modeling race and ethnicity, though the files are better at correctly identifying whites than nonwhites. Other variables, such as educational attainment and income, are much less accurate. Still, the voter file presents opportunities for researchers interested in voting behavior and some other questions about the electorate.
Voter files also include data on partisanship. Most files include a modeled partisanship score. In addition, the file also includes a record of a voter’s party registration in the 30 states plus the District of Columbia where voters may choose whether or not to register with a party (Democrats, Republicans, Green Party, Libertarian Party, etc.).
This analysis uses the recorded partisan registration of registered voters in these jurisdictions based on data in their voter file record. As described in more detail below, partisan registration differs from partisan identification (or partisan affiliation), which is a measure of what a person considers themselves to be at a particular point in time. While these measures are often aligned, they may not always be. For instance, a person may consider themselves an independent who leans Republican but register as a Republican in order to vote in a GOP primary. Or a person may have registered with a party in the past and have shifted in their partisan identification yet not updated their registration to reflect their shifting identification.
Shifts in partisan registration among the youngest cohort of voters
With the two 1% voter files, we can look at changes in the distribution of party registration across 30 states and the District of Columbia between 2015 and 2018. (Keep in mind that our 2018 voter file snapshot was taken in the spring, well before the fall campaign season and recent events, so the data presented here do not include more recent voter registrations, which could paint a different picture.)
The overall distribution of partisanship was quite similar in 2015 and 2018. However, the distribution of partisanship within certain groups is very different.
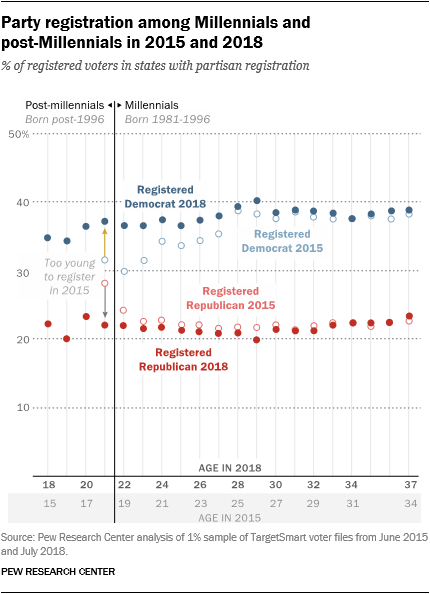
The distribution of party registration among younger voters has changed substantially between 2015 and 2018. For example, in 2015, Democrats had a fairly modest 3-point registration edge among 18-year-old voters (those born in 1997). Three years later, the Democratic advantage among now 21-year-olds is considerably wider: 37% are registered as Democrats, while just 22% are registered as Republicans. Similar shifts have happened among younger Millennials (those between 22 and 27). The magnitude of the shifts drops off among older Millennials.
Since we have two snapshot files, we can’t determine how much of the shift in the balance of partisan registration is attributable to individuals changing their partisan registration and how much is attributable to new registrations. But especially among the youngest voters, new registrations are almost certainly driving the bulk of this change, simply because the majority of 2018 registered voters in their early 20s (even those eligible to vote in 2015) weren’t registered to vote in 2015. For instance, the 2018 1% file has records for more than 16,000 voters born in 1996 in jurisdictions with party registration (which implies 1.6 million in these states). By comparison, our 2015 1% file had records for only about 7,500 voters who were born in 1996 and lived in states with party registration (implying about 750,000 overall).
The shift in partisanship among Millennials is more pronounced among Millennial women than Millennial men. The share of Millennial men who are registered Democrats is now 1 percentage point higher than three years ago, while the GOP registration share is unchanged. Among Millennial women, the share who are now registered Democrats is 2 percentage points higher than in 2015, while the share who are registered Republicans has dropped 1 percentage point.
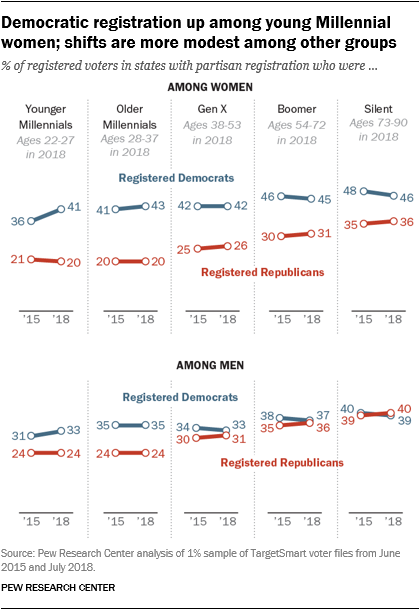
As seen to the left , the changing distribution of partisan registration is clearest among the youngest Millennials, and this shift is particularly pronounced among women in this cohort.
In 2015, 36% of women born after 1990 were registered with the Democratic Party, compared to 41% of older Millennial women (those born from 1981 to 1990). By 2018, the distribution of partisanship among younger Millennial women was more similar to older Millennial women (41% registered Democrats among those born after 1990, compared with 43% among those born earlier).
In 2015, younger Millennial men were also less likely than older Millennial men to be registered with the Democratic Party. In 2018, the two groups look much more similar. The shift among younger Millennial men (2 points toward the Democratic Party) was less pronounced than among women in this cohort.
Democratic registration is essentially unchanged for Generation X women. Democratic registration is slightly lower in 2018 than 2015 for Baby Boomer (1 percentage point) and Silent (2 percentage points) women, while the share registering as Republicans is correspondingly higher. A similar pattern is evident among men in the Generation X, Boomer and Silent age cohorts.
Some states have seen shifts in party registration
Registration has moved dramatically in some states since 2015. These changes have had the effect of bringing the partisan registration balance into closer alignment with state voting patterns.
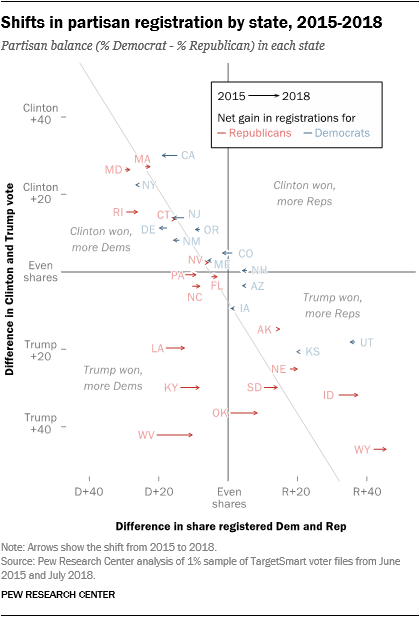
For example, voter registrations in West Virginia, Louisiana, Kentucky and Oklahoma all have moved in a Republican direction since 2015. These states had unusually high rates of Democratic partisan registration given that all four states have voted consistently Republican in recent presidential elections. (For historical reasons, party registration in southern states over the last several decades has not tracked with their voting patterns in national elections.)
West Virginia has voted Republican in the last five presidential elections (since 2000) and voters in that state supported Republican Donald Trump over Democrat Hillary Clinton by more than 40 percentage points in 2016. Nonetheless, West Virginia voters were 21 percentage points more likely to be registered as Democrats than Republicans in 2015. The Democratic advantage in registration has declined significantly in the last three years. Similar patterns are seen in Louisiana, Kentucky and Oklahoma.
On the other side, California, which had higher rates of Republican identification than one might expect given voting patterns in the state, has moved in a Democratic direction since 2015.
How party registration differs from party identification
When considering the above data, it’s important to remember that partisan registration is distinct from party identification. Party identification is collected by asking individuals which party they identify with or lean toward. Partisan registration, on the other hand, relates to one’s voter registration and in many states is used to limit access to primary elections where political parties select their candidates.
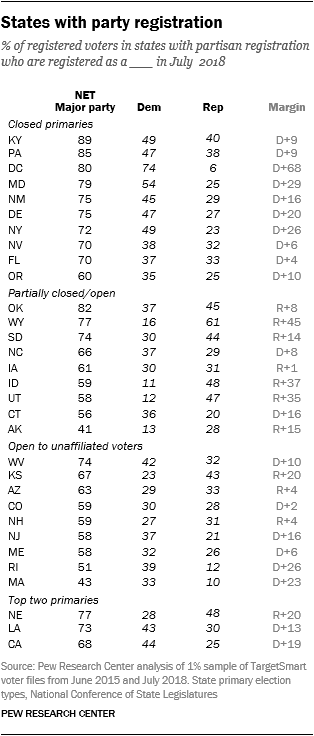
Not all states have partisan registration, and even among those that do there are important differences in the ways primary elections are conducted across states. Some states have closed primaries where only voters registered with the party are permitted to participate in the primary. Other states have open primaries in which voters have the option of choosing which primary they want to vote in when they arrive at the polling station (regardless of whether or not they are registered with a party).
In other states, primary elections are open to those registered with a party and to unaffiliated voters — but not for those who are registered with a different party. A handful of states (California, Louisiana and Nebraska) hold their elections in two stages, with the top two candidates in the first election advancing to the second election. In these states, all registered voters are eligible to participate in both elections, regardless of whether or not they are registered with a party.
Overall, there is a correlation between partisan registration in a state and party identification (or the proportion of people who voted for the Democratic or Republican candidate in an election). But there are exceptions. For example, as shown above, the balance of party registration is similar in heavily Democratic California and in heavily Republican Louisiana. That is, even though the states tend to vote in very different ways, Democrats outnumber Republicans among registered voters in both places.
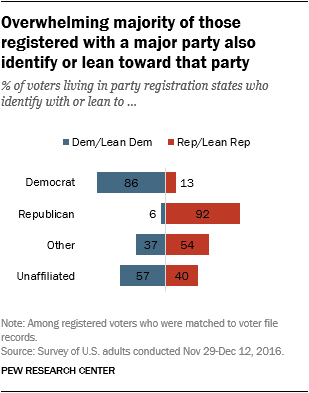
Still, at the individual level, there is a clear correlation between partisan registration and partisan identification. An overwhelming share of voters who are registered as Democrats or Republicans also identify with or lean to that party when asked in surveys, as previous work by Pew Research Center has shown.
Participants in the Center’s American Trends Panel are matched to voter file records, allowing us to compare their self-reported political identity with party registration (among those who are registered to vote and living in a state with partisan registration).
Among registered Democrats, 86% also identified or leaned toward the Democratic Party, while 92% of registered Republicans said they leaned toward or identified with the Republican Party.
A substantial share of voters in the study were not registered with either major party. However, almost all of these voters had partisan leanings or a partisan identity of some sort. Overall, 57% of unaffiliated voters in party registration states said they lean toward or identify with the Democratic Party, and 40% said they lean toward or identify with the Republican Party.
Bradley Jones is a research associate focusing on U.S. politics and policy at Pew Research Center.
Referring URL: https://medium.com/pew-research-center-decoded/what-voter-files-can-tell-us-about-trends-in-party-registration-3b6387018fb3
